


Data Assimilation, Machine Learning and Causal Discovery
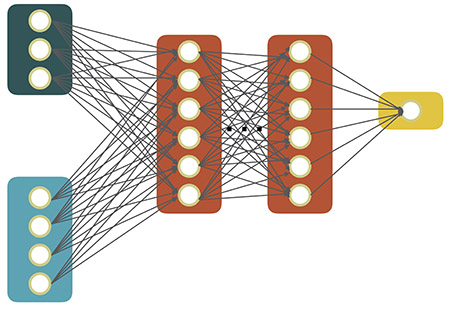
Our research focuses on using and extending existing data assimilation, machine learning and causal discovery methods to enhance understanding of the functioning of the Earth system from small-scale microphysics to global climate, maximizing the information extracted from observational and model data.
Faculty
Sample Coursework During First Two Years of Graduate Program
Fall, Year 1
ATS 601: Atmospheric Dynamics I
ATS 620: Thermodynamics and Cloud Physics
ATS 621: Atmospheric Chemistry
ATS 640: Synoptic Meteorology
Spring, Year 1
ATS 606: Introductions to Climate
ATS 622: Atmospheric Radiation
ATS 655: Objective Analysis
ATS 693: Responsible Research in Atmospheric Science
Fall, Year 2
Courses vary based on the student’s scientific interests.
Spring, Year 2
ATS 651: Data Assimilation
Courses vary based on the student’s scientific interests.